


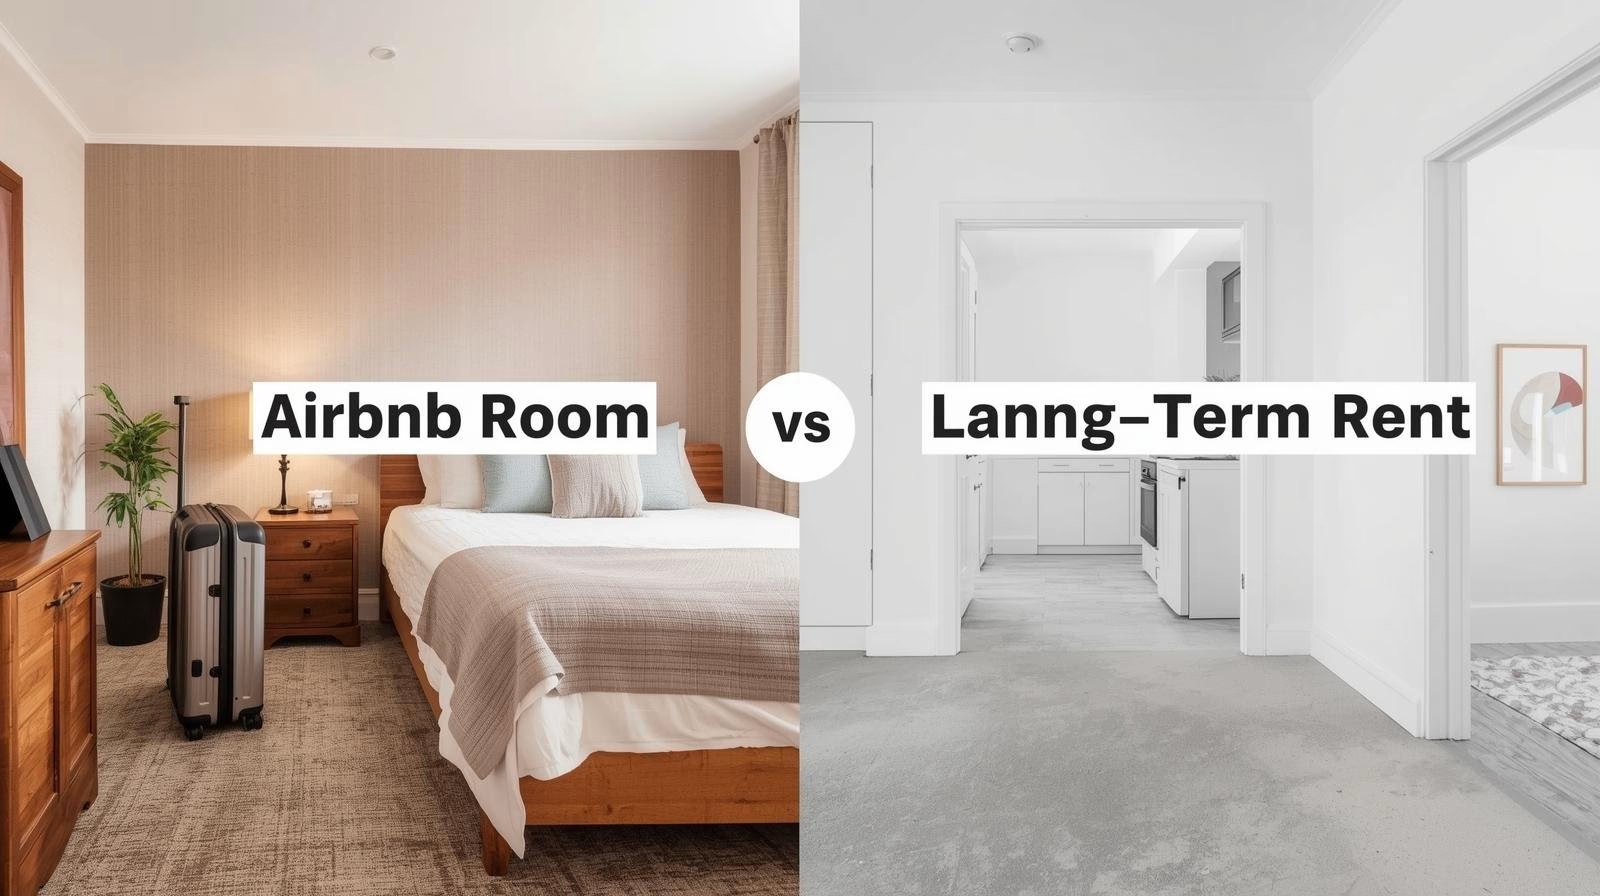
The airbnb vs long-term rental comparison appears straightforward on its face: short-term rentals charge more per night, so they must earn more. That logic holds when occupancy is high, regulations permit full operation, and the host's time isn't counted. When you factor in realistic occupancy rates by market, city-specific STR ordinances that restrict or ban most hosting, per-turnover cleaning costs, higher insurance requirements, tax treatment differences, and the 5 to 15 hours per week that active hosts typically spend managing a listing, the comparison gets complicated quickly. The answer depends entirely on your specific market, your specific property, and the full cost picture — not a headline nightly rate.
Some markets support Airbnb revenue that runs two to three times what a long-term tenant would pay. Others have been reshaped by regulation — New York City's Local Law 18 effectively made full-unit short-term renting non-viable for most hosts. The answer to which model pays better isn't universal. It's a spreadsheet question answered market by market, property by property.
Airbnb vs Long-Term Rental: What Gross Revenue Actually Looks Like
Short-term rental platforms generate higher gross nightly rates than long-term leases on the same property. A room that would rent for $1,200/month under a year-long lease might price at $80 to $120/night on Airbnb. At 100% occupancy, that's $2,400 to $3,600 per month — a striking difference. But 100% occupancy is not a planning assumption; it's a theoretical ceiling almost no property reaches across a full year.
Occupancy is where the comparison breaks down in practice. AirDNA, which tracks Airbnb and Vrbo data across markets, reports that average occupancy rates vary considerably across market types. Strong urban tourism markets — Las Vegas, Nashville, Miami — tend to produce occupancy in the 60% to 75% range for well-managed listings. Secondary markets and suburban areas often run 40% to 55% on average. Rural and seasonal markets can swing from near zero in off-season to near 100% in peak weeks, producing a wide annual average that masks dangerous monthly cash flow gaps.
At 55% occupancy, a room priced at $100/night generates roughly $1,650/month gross — before any expenses. At that point, the long-term lease at $1,200/month is generating $1,200 reliably, and the STR is only ahead by $450 before accounting for the additional costs that short-term renting introduces. In many scenarios, that gap is fully consumed by platform fees and a single cleaning per week.
To make the comparison concrete, consider a property in a mid-tier market priced at $110/night on Airbnb:
| Scenario | Occupancy | Gross Monthly | Platform Fee (~15%) | Cleaning (3x/wk avg) | Net Before Other Costs |
|---|---|---|---|---|---|
| Strong year | 70% | $2,387 | $358 | $600 | $1,429 |
| Average year | 52% | $1,716 | $257 | $480 | $979 |
| Slow year | 35% | $1,155 | $173 | $360 | $622 |
| Long-term lease | — | $1,200 | $0 | $0 | $1,200 |
At average occupancy with realistic cleaning costs, the long-term option is ahead in net cash — and the STR result still has utilities, supplies, and insurance to subtract. The honest framing of the airbnb vs long-term rental gross revenue comparison requires your specific market's realistic occupancy rate, your actual average nightly rate (not peak pricing), and a full accounting of expenses for both models.
STR Regulations: The Variable That Can End the Math

Short-term rental regulations have changed the calculus in dozens of major U.S. markets, and the trend has moved toward tighter restrictions. Understanding the current local regulatory environment is the first step in any airbnb vs long-term rental analysis — because in regulated markets, the STR option may not be legally available at all.
New York City. Local Law 18, which took effect in September 2023, requires hosts to register with the city, be present during all guest stays, and limit rentals to a maximum of two guests. The law effectively prohibits renting a full unit while the host is absent — which describes the majority of Airbnb listings. The city has enforced the law by requiring platforms to delist unregistered properties. Full-unit short-term renting is, for most hosts in NYC, no longer legally viable.
Los Angeles. The Home Sharing Ordinance restricts short-term rentals to a host's primary residence, with a cap on the number of nights per year for extended hosting. Non-primary properties cannot be listed on Airbnb or similar platforms under the ordinance. Violations carry fines.
San Francisco similarly restricts STRs to primary residences, requires annual registration with the city, and mandates that the host occupy the unit for at least 275 days per year. New Orleans implemented cap regulations and zoning restrictions following sustained pressure from long-term housing advocates. Denver requires a license and proof of primary residence before any listing goes live. Austin and Phoenix both require permits and have debated primary-residence restrictions in recent legislative cycles.
Honolulu stands out for particularly aggressive enforcement: the city banned short-term rentals in residential zones in 2022, with a phase-in period, and the restriction covers most of the city's residential housing stock. Nashville emerged as a cautionary tale — after years of lenient rules that supported a booming STR market, the city reclassified many properties under stricter permit categories that significantly reduced the number of legal whole-home STR listings.
The pattern across these cities is consistent: STR markets that boomed between 2015 and 2020 have faced increasing regulation as housing advocates and city governments responded to concerns about housing supply. Any city that has experienced a visible housing shortage should be evaluated for near-term regulatory risk before capital is committed to an STR setup.
Before furnishing, buying equipment, setting up an Airbnb listing, or registering on platforms, verify current regulations from the local government's official source. City ordinances in this space change frequently enough that any specific detail here should be confirmed against current local law before relying on it. Confirming this before spending $8,000 to $15,000 furnishing a short-term rental is the minimum due diligence.
The True Expense Side: What Each Model Actually Costs

Both models carry expenses not visible in gross revenue comparisons. Net income is what matters, and the expense structures of the two models are fundamentally different.
Short-term rental expenses:
Platform commission. Airbnb charges hosts a service fee on each booking. Verify the current fee structure at airbnb.com directly — fee structures have changed over time and vary by hosting type and settings. At the time most hosts encounter it, the host-only fee runs in the range of 15% to 17% of the booking subtotal, though the split-fee model (where hosts pay less and guests pay more) also exists.
Professional cleaning. After every guest stay, the unit must be thoroughly cleaned, linens changed, and supplies checked. In most markets, professional cleaning for a one-bedroom runs $80 to $150 per turnover. For a two-bedroom, expect $120 to $200. At three turnovers per week, that's $240 to $600 per week in cleaning costs alone — often the single largest expense category for high-volume STR properties.
Consumable supplies. Coffee, soap, shampoo, toilet paper, paper towels, trash bags, and similar items require regular restocking. For a busy listing, this can run $100 to $200 per month.
Higher utilities. Short-term guests run HVAC, water, and electricity at higher rates than long-term tenants who are paying their own bills. Expect a 15% to 30% increase in utility costs relative to the same unit with a long-term tenant.
STR-specific insurance. Standard homeowners policies and most landlord policies explicitly exclude short-term rental activity. If a guest is injured, causes property damage, or files a liability claim during a stay not covered by your policy, you may have no coverage. Airbnb's AirCover provides some protection, but it is not a substitute for a proper insurance policy. STR-specific endorsements or standalone products from carriers that serve the short-term rental market fill this gap. Budget $1,500 to $3,500 annually depending on property value and coverage level.
Furnishing and setup costs. Short-term rentals require fully furnished, photogenic spaces with quality bedding, kitchen equipment, linens, and guest-ready presentation. Setting up a one-bedroom unit from scratch with guest-quality furnishings typically runs $5,000 to $15,000. This is a capital cost that long-term rentals don't require.
Property management tools. Smart locks, noise monitors, dynamic pricing software, and channel management tools add $50 to $200/month for a host running any kind of systematic operation.
Long-term rental expenses:
Maintenance and repairs. The widely cited rule of thumb is 1% of property value annually, though actual costs vary considerably with property age and condition. A $300,000 property budgets $3,000 per year for maintenance — a number that can be exceeded in a single bad year with a roof, HVAC, or plumbing issue, and easily undershot in stable years.
Vacancy costs. Even the most stable rental properties experience occasional vacancy. Tenant turnover typically takes 30 to 45 days to fill — cleaning, paint touch-ups, listing, and screening. Budget for one month of lost rent every 18 to 24 months as a baseline assumption, more if turnover is frequent.
Property management fees (if used). Professional property management typically costs 8% to 12% of monthly rent, plus a leasing fee of one-half to one month's rent each time a new tenant is placed. A $1,500/month rental managed professionally might net $1,320 to $1,380/month before maintenance and vacancy.
Insurance (landlord policy). Landlord policies run roughly $1,000 to $2,000 annually for a typical single-family rental, depending on location, coverage level, and property value. Long-term rentals also typically require landlord liability coverage as a separate line item or as part of the overall policy.
Time Investment: The Cost Most Revenue Projections Omit
The airbnb vs long-term rental comparison almost always omits the host's time entirely. That omission skews the comparison significantly in favor of short-term rentals on paper while obscuring a real cost that matters enormously in practice.
Active Airbnb hosts report spending anywhere from 5 to 20 hours per week depending on occupancy, listing volume, and whether they manage cleaning themselves or hire it out. The lower end of that range — 5 to 7 hours — typically applies to hosts with a single well-run listing, professional cleaners, smart locks that eliminate in-person check-ins, and automated messaging for guest communications. The upper end applies to hosts managing multiple listings, doing their own cleaning between guests, and handling all guest contact personally.
Even at the conservative 5-hour estimate, that's 260 hours per year on Airbnb management. If the incremental net income from the STR model versus the long-term rental works out to $6,000 per year, the effective hourly rate for that work is $23/hour. That's not necessarily a bad return — but it's not passive income, and it requires honest accounting to see it clearly.
Long-term rental management, by contrast, typically involves 1 to 3 hours per month outside of tenant turnover periods: responding to maintenance requests, coordinating repairs, handling the occasional lease or payment issue. The time commitment increases significantly during turnovers and in contentious tenant situations, but the baseline is dramatically lower than active STR hosting.
For property owners with full-time employment, demanding freelance schedules, or significant existing commitments, the time differential between models matters beyond hourly rate calculations. A high-occupancy STR is a part-time job running concurrently with whatever else you do. A stable long-term rental managed professionally or self-managed with good tenant selection is a comparatively passive income source. Which model fits your actual available time is a constraint that belongs in the analysis alongside the revenue math.
Tax Treatment: Where the Models Diverge Significantly

Short-term and long-term rental income are treated differently under federal tax law, and the differences affect net returns in ways that matter to the final comparison.
Short-term rentals (average guest stay under 7 days) may qualify for more active treatment under IRS rules if the owner materially participates in the activity. For most hosts who actively manage their STR, the activity may qualify for Schedule E reporting with potentially favorable treatment. However, short-term rentals also generate self-employment tax liability if the host provides substantial services similar to a hotel — in which case the income is reported on Schedule C and subject to SE tax at 15.3%. Whether your Airbnb activity rises to this level depends on what services you provide and requires professional tax guidance to classify correctly.
Long-term rentals are typically passive income under IRS rules, reported on Schedule E. Losses from long-term rentals can offset other passive income but generally cannot offset active wages or self-employment income — unless you qualify as a real estate professional under Section 469, which requires 750+ hours and majority of professional time in real estate activities.
Depreciation applies to both models. Residential property is depreciated over 27.5 years. A $300,000 property (with $50,000 attributable to land, which is non-depreciable) generates roughly $9,090 per year in depreciation deductions — a significant offset against taxable rental income. This applies regardless of whether the property is rented short or long term.
Occupancy taxes. Short-term rentals in most jurisdictions are subject to lodging or occupancy taxes — the same taxes hotels pay. These are often collected and remitted by Airbnb in major markets, but host awareness and verification is necessary in markets where Airbnb does not collect on behalf of hosts. Long-term rentals are generally not subject to occupancy taxes.
The combination of depreciation, expense deductions, and the STR vs. long-term distinction in passive activity rules creates a tax picture that looks different for each property owner depending on income level, filing status, and activity level. The revenue comparison between models should run through tax assumptions relevant to your specific situation before drawing conclusions about which model generates more after-tax income.
Making the Decision: The Framework That Accounts for All Variables
The question of whether airbnb vs long-term rental pays better for a specific property in a specific market comes down to a structured comparison across five dimensions: gross revenue potential at realistic occupancy, total annual expenses for each model, time investment at a realistic hourly value, regulatory feasibility, and tax treatment at your marginal rate.
A framework for the comparison:
Step 1. Research your market's realistic STR occupancy rate using AirDNA's free market preview tools or similar data sources. Apply that occupancy rate — not the optimistic version — to your estimated nightly rate. That's gross STR revenue.
Step 2. Pull comparable long-term rental rates from Zillow, Craigslist, or Apartments.com for similar properties in your area. That's your gross LTR baseline.
Step 3. Subtract full expense estimates for each model. For STR: platform fees, cleaning, supplies, utilities premium, STR insurance, and any management tools. For LTR: maintenance reserve, vacancy allowance, landlord insurance. The net figures are your pre-tax, pre-time cash comparison.
Step 4. Assign a time cost to STR management. Estimate your realistic weekly hours, multiply by 52, and value that time at your opportunity cost — what else you could be doing with those hours. Subtract that from STR net income.
Step 5. Apply a rough tax adjustment. If STR income will be subject to SE tax and LTR income will not, that's a 15.3% difference on the margin.
Step 6. Check regulatory status. If your city restricts STRs to primary residences and you're looking at an investment property, the model may not be legally available regardless of the revenue math.
For most property owners who run this comparison honestly, the result is closer than the headline nightly rate implies. In some markets and some property configurations, the STR model wins clearly even after all costs. In others — particularly regulated markets, lower-occupancy markets, and situations where host time has real opportunity cost — the long-term rental produ
None of this is financial advice. Your situation depends on variables this article can't see — taxes, risk tolerance, time horizon, dependents. A fiduciary advisor can model your specific case.




No comments yet